Table Of Contents
Background
Debugging takes a great part in application development, debuggers provide the capability to inspect the internal state of the execution programs, which make it easier to let the program work properly. It is hard to imagine a programming world without debugger.
Luckily, WAMR has supported source debugging feature based on lldb, and now is ready for use.
Thanks @Paolo Severini from Microsoft for providing the patched lldb with WebAssembly support!
Thanks @Wu Zhongmin from Ant group for co-working on the source debugging feature!
🎉🎉🎉
Setup
Building WAMR with interpreter debugging enabled
git clone https://github.com/bytecodealliance/wasm-micro-runtime.git
cd wasm-micro-runtime
export WAMR_REPO=`pwd`
cd product-mini/platforms/linux
mkdir build && cd build
cmake .. -DWAMR_BUILD_DEBUG_INTERP=1 -DWAMR_DISABLE_HW_BOUND_CHECK=1
make
export IWASM=`pwd`/iwasm
We need to disable the
hardware boundary checkfeature, otherwise the debugger will not be able to stop when anout of bounds memory accessexception occurs.We will use
$IWASMto represent the generated iwasm binary in this step, and$WAMR_REPOrepresent the path to WAMR repo.Building lldb from source code
Official lldb and gdb doesn’t support WebAssembly yet, we need to build the patched lldb manually from source code.
git clone --branch release/13.x --depth=1 https://github.com/llvm/llvm-project.git
cd llvm-project
git apply $WAMR_REPO/build-scripts/lldb-wasm.patch
mkdir build && cd build
cmake -DCMAKE_BUILD_TYPE:STRING="Release" -DLLVM_ENABLE_PROJECTS="clang;lldb" -DLLVM_TARGETS_TO_BUILD:STRING="X86;WebAssembly" -DLLVM_ENABLE_LIBXML2:BOOL=ON ../llvm
make -j $(nproc)
export LLDB_BUILD_DIR=`pwd`
We will use
$LLDB_BUILD_DIRto represent the current build dirBinary release for this patched lldb is planned and WIP, once finished, we can download the binaries directly😀.
Debugging with CLI
Let’s take a simple application written in C for example.
// main.c

#include "stdio.h"

double global_variable = 0;

void foo2()
{
    printf("The global var is: %f\n", global_variable);
}

int foo(int x)
{
    printf("The parameter is: %d\n", x);
    foo2();
    return x;
}

int main(int argc, char *argv[])
{
    int local_variable = 0;
    int i = 0;

    foo(local_variable);

    for (i = 0; i < local_variable; i++) {
        printf("Enter loop with i = %d\n", i);
    }

    return 0;
}
This simple code involves local variable, global variable, function call and loop, which can used to demonstrate most abilities of the debugger.
- Build this sample code with
wasi-sdk
/opt/wasi-sdk/bin/clang -g main.c -o main.wasm -Wl,--export=malloc,--export=free
Don’t enable optimizations, and don’t miss the
-goption, otherwise the generated wasm file will not contain debug information.
-Wl,--export=malloc,--export=freeis required if you want to use theevaluation expressionfeature, please refer to issue with evaluation feature for more details.
- launch the wasm app with debug feature enabled
$IWASM -g=127.0.0.1:1234 main.wasm
#         ^^^^^^^^^ ^^^^
#         bind addr:port
- open another terminal to launch lldb and attach to the debug server
Note: In the new terminal, the environment variable
LLDB_BUILD_DIRmay not exists, you may need to set it again manually.
# set LLDB_BUILD_DIR <path to your lldb build dir>
$LLDB_BUILD_DIR/bin/lldb
(lldb) process connect -p wasm connect://127.0.0.1:1234
Process 1 stopped
* thread #1, name = 'nobody', stop reason = signal SIGSTOP
    frame #0: 0x40000000000001c6 main.wasm
->  0x40000000000001c6: call   7
    0x40000000000001cc: call   12
    0x40000000000001d2: local.set 0
(lldb)
Everything ready!🍻 Now we can start debugging the application.
Breakpoint/Continue
Now let’s create a breakpoint on a function and continue execution.
(lldb) b foo
Breakpoint 1: where = main.wasm`foo + 37 at main.c:14:38, address = 0x4000000000000273
(lldb) c
Process 1 resuming
Process 1 stopped
* thread #1, name = 'nobody', stop reason = breakpoint 1.1
    frame #0: 0x4000000000000273 main.wasm`foo(x=0) at main.c:14:38
       11
       12   int foo(int x)
       13   {
    -> 14       printf("The parameter is: %d\n", x);
       15       foo2();
       16       return x;
       17   }
Backtrace
(lldb) bt
* thread #1, name = 'nobody', stop reason = breakpoint 1.1
  * frame #0: 0x4000000000000273 main.wasm`foo(x=0) at main.c:14:38
    frame #1: 0x400000000000030e main.wasm`__main_argc_argv(argc=1, argv=0x00011500) at main.c:24:5
    frame #2: 0x4000000000002772 main.wasm
    frame #3: 0x40000000000003a8 main.wasm
    frame #4: 0x40000000000001d2 main.wasm
You can use
up/downto navigate across the stack framesDisplay variables
(lldb) up
(lldb) fr v # dump variables from current stack frame
(int) argc = 1
(char **) argv = 0x00011500
(int) local_variable = 0
(int) i = 0
(lldb) fr v global_variable # dump global_variable
(double) global_variable = 0
Evaluate expressions
(lldb) e local_variable
(int) $0 = 0
(lldb) p local_variable
(int) $1 = 0
(lldb) e local_variable > 0
(bool) $2 = false
Note:
- If you encounter an error while using evaluation feature, please refer to issue with evaluation feature
- in lldb
pcommand actually useevaluation.
Step/Finish
(lldb) s
Process 1 stopped
* thread #1, name = 'nobody', stop reason = step in
    frame #0: 0x400000000000283c main.wasm
->  0x400000000000283c: global.get 0
    0x4000000000002842: i32.const 16
    0x4000000000002844: i32.sub
    0x4000000000002845: local.tee 2
(lldb) n
Process 1 stopped
* thread #1, name = 'nobody', stop reason = instruction step over
    frame #0: 0x4000000000002842 main.wasm
->  0x4000000000002842: i32.const 16
    0x4000000000002844: i32.sub
    0x4000000000002845: local.tee 2
    0x4000000000002847: global.set 0
(lldb) finish
Process 1 stopped
* thread #1, name = 'nobody', stop reason = step out
    frame #0: 0x4000000000000293 main.wasm`foo(x=0) at main.c:14:5
   11
   12   int foo(int x)
   13   {
-> 14       printf("The parameter is: %d\n", x);
   15       foo2();
   16       return x;
   17   }
(lldb) finish
Process 1 stopped
* thread #1, name = 'nobody', stop reason = step out
    frame #0: 0x400000000000030e main.wasm`__main_argc_argv(argc=1, argv=0x00011500) at main.c:24:5
   21       int local_variable = 0;
   22       int i = 0;
   23
-> 24       foo(local_variable);
   25
   26       for (i = 0; i < local_variable; i++) {
   27           printf("Enter loop with i = %d\n", i);
Modify the value
(lldb) e local_variable = 5
(int) $3 = 5
(lldb) c
Process 1 resuming
Process 1 exited with status = 0 (0x00000000)
Since we modify the value of
local_variableto 5, we will enter the loop 5 times, and then the program exit.Exception
When debugging a native executable, the debugger will stopped once there is a segment fault, and the developer can then see the callstack to the bug code.
However, in WebAssembly the memory is protected by sandbox, even the application access some invalid spaces, the runtime will raise an exception rather than segment fault.
In WAMR, we extend the debug engine to pause on exception, so the developer can inspect the latest state of the program and know which line in source code causes this problem.
int main(int argc, char *argv[])
{
    int local_variable = 0;
    int i = 0;

    *(int *)(-1) = local_variable;

    foo();

    for (i = 0; i < local_variable; i++) {
        printf("Enter loop with i = %d\n", i);
    }

    return 0;
}
This time we add a line to the original
main.c.(int *)(-1)is a very large space and certainly go beyond the linear memory boundary, this will trigger anout of bound memory accessexception./opt/wasi-sdk/bin/clang -g main.c -o main.wasm $IWASM main.wasm Exception: out of bounds memory accessLaunch it with debug feature, and continue execution
$IWASM -g=127.0.0.1:1234 main.wasm$LLDB_BUILD_DIR (lldb) process connect -p wasm connect://127.0.0.1:1234 Process 1 stopped * thread #1, name = 'nobody', stop reason = signal SIGSTOP frame #0: 0x40000000000001c6 main.wasm -> 0x40000000000001c6: call 7 0x40000000000001cc: call 12 0x40000000000001d2: local.set 0 (lldb) c Process 1 resuming Process 1 stopped * thread #1, name = 'nobody', stop reason = Exception: out of bounds memory access frame #0: 0x4000000000000290 main.wasm`foo(x=0) at main.c:14:18 11 12 int foo(int x) 13 { -> 14 *(int *)(-1) = 100; 15 printf("The parameter is: %d\n", x); 16 foo2(); 17 return x;Then we can see the call stack and inspect stack frames. If the exception occurs in a large project, this feature will save a lot of time to find the root cause.
Now we have tried some common used features of debugger, but it’s finished by command line. Is there a more efficient way?
Of course! See: Debugging wasm with VSCode!
Remote debugging
When debugging feature enabled, WAMR will host a gdb server and wait for a debugger connection, it is already a remote debugging architecture.
If you want to run runtime and debugger in different machine, then you should take care about these 3 things:
Bind address
0.0.0.0rather than127.0.0.1There should be a copy of source code on the debugger machine, and a source-map is correctly set after launching LLDB, otherwise the debugger will not be able to find the source lines
(lldb) settings set -- target.source-map <src_dir> <dest_dir>WAMR uses Unix signal numbers, if your debugger runs on non-Linux platforms (e.g. Windows), remember to set the remote platform before connecting
(lldb) platform select remote-linux
(lldb) process connect -p wasm connect://xxx.xxx.xxx.xxx:1234
Issue with evaluation feature
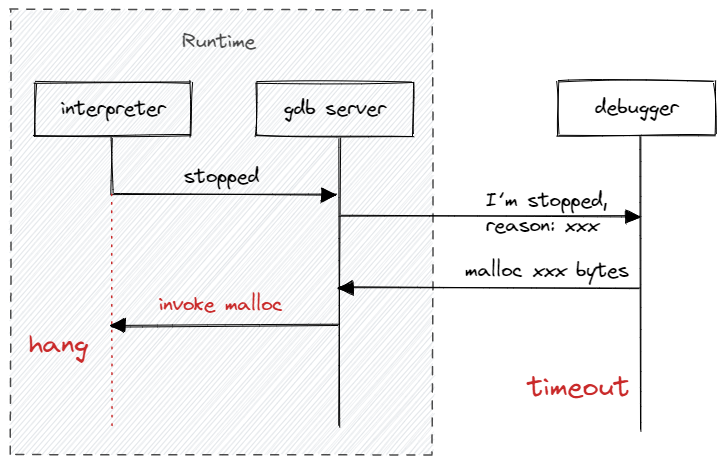
lldb will require a large buffer inside linear memory when evaluating an expression, we call it Evaluation buffer here.
The problem happens when the application is built with wasi mode and exported the malloc function:
- the interpreter stops at somewhere because of breakpoint or stepping, lldb become interactive
- user enter a command to evaluate an expression
- lldb send a allocate memory request to runtime (debug server)
- runtime will invoke the
mallocfunction in wasm application (which means we need to re-enter the interpreter), but at this moment the interpreter is at stop state and waiting debugger’s signal to continue execution, which cause the program to hang.
To solve this problem, we try to reserve enough memory space in linear memory during loading, and if the runtime failed to allocate this buffer during loading, a warning will be displayed:
[09:43:45:506 - 7FA23A5EFB80]: warning: allocate 544768 bytes memory failed
[09:43:45:540 - 7FA23A5EFB80]: WASM Debug Engine warning: failed to allocate linear memory for execution.
Will not be able to evaluate expressions during debugging
[09:43:45:733 - 7FA23A96F700]: control thread of debug object 0x55fb399d3d20 start

[09:43:45:841 - 7FA23A96F700]: Debug server listening on 127.0.0.1:1234
and any evaluation command in debugger session will not work and get such kind of error:
error: Couldn't allocate space for materialized struct: Couldn't malloc: address space is full
error: errored out in DoExecute, couldn't PrepareToExecuteJITExpression
How to fix the warning?
If you don’t need the evaluation feature, then just ignore the warning and it will not influence other features, otherwise the solution depends on the libc mode
If your app is built with
libc-wasiIf your wasm module doesn’t export
mallocandfree, try to rebuild your wasm module with-Wl,--export=malloc,--export=freeoption, or refer to the method forlibc-builtinmodeOtherwise, seems you set the
maximum memoryflag during compiling and the given value is not enough, try to rebuild with a larger value or remain maximum memory unspecified.
If your app is built with
libc-builtinIn this mode, all the dynamic memory goes into WAMR’s
app_heap, the design of WAMR’s linear memory will not be covered by this blog post, please refer to our memory_tune document for more details.The problem is
app_heapis not enough, specify a larger value can solve this$IWASM -g=127.0.0.1:1234 --heap-size=655360 main.wasm
This size should be no less than
532 KB(544768 bytes)
FAQ
Does WAMR’s source debugging support
watchpoint?Currently not, but this feature is planned and on the priority list.
Which platforms are supported
Currently the source debugging feature supports Linux, Windows, MacOS, Android, other platforms may work but not well tested.
Does this support debugging
AssemblyScript?Unfortunately, No. We use
dwarfbased debugging solution while AssemblyScript currently uses source map.Does this feature support embedded devices?
Source debugger feature mainly depends on socket interface.
If your platform support socket then it should be OK.
But for devices only have
USARTinterface, currently we don’t support that. This requires a usart based communication channel, it should not be very complex to implement, but it’s not on our priority list.Does this work with AOT/JIT
Debugging AoT/JIT module is totally a different solution which is not covered by this blog.
Currently WAMR has a highly experimental support for AOT/JIT debug, please refer to the document for more details.
Does this work with
multi-thread wasm application?No, currently the debugger can’t distinguish stack frame from different thread, if you attempt to debug a multi-thread wasm app, there may be unexpected behavior.
Does this work with
multiple native thread and each thread runs a wasm app?Yes, each app will have its own gdb server, they are totally independent.